c("New York Times",
  "New Yorker",
  "Wall Street Journal",
  "Los Angeles Times") ->
  publishers

here("posts", "crossword_times", "crossword_times.csv") |>
read_csv(col_types = "ccD") |>
  filter(publisher %in% publishers) |>
  mutate(publisher,
         day = factor(wday(date, week_start = 1, label = TRUE, abbr = FALSE)),
         minutes = period_to_seconds(ms(time))/60,
         .keep = "none") ->
crossword_timesCrosswords, Violin Plots, and Dubious Distinctions in Data Analysis
So-called “descriptive” analysis.
Introduction
Data analysis comprises a broad range of practices undertaken to extract meaning, discover insights, or inform decisions on the basis of data. Within this set of practices, it’s common to draw a distinction between descriptive and inferential analysis.
In this project we’ll analyze how long it takes to solve a crossword puzzle, learn why descriptive and inferential data analysis are actually inextricable from one another, and resolve a raging controversy about violin plots.
Data
The crosswords published in major American newspapers differ in difficulty according to the day of the week. For example, the New York Times’ guide explains that their Monday puzzles are the easiest and their Saturday puzzles the hardest. Meanwhile, the Sunday puzzles have easy clues but a large grid, and the Thursday puzzles have some unique gimmick. By contrast, the New Yorker’s Monday puzzle is their most challenging, with the difficulty mostly decreasing over the course of the week.
I track how long it takes me to solve the New York Times, Los Angeles Times, New Yorker, and Wall Street Journal crosswords in a CSV file.
Descriptive Analysis Doesn’t Exist
At this point we’re ready to do “descriptive” data analysis. We can count observations, calculate so-called “five-number” summaries, and so on.
Code
crossword_times |>
  group_by(publisher, day) |>
  reframe(
    Count = n(),
    Mean = mean(minutes),
    value = fivenum(minutes),
    name = c("Minimum", "1ˢᵗ Quartile", "Median", "3ʳᵈ Quartile", "Maximum")) |>
  pivot_wider() |>
  mutate(across(where(is.numeric), \(x) round(x, 1))) |>
  gt(rowname_col = "day", groupname_col = "publisher") |>
  tab_header(title = "Crossword Solve Times: Descriptive Statistics") |>
  opt_align_table_header(align = "center") |>
  tab_options(table_body.hlines.color = "transparent") |>
  tab_style(
    style = list(cell_text(color = "#555655", align = "center")),
    locations = list(cells_column_labels(), cells_stub(), cells_stubhead())) |>
  tab_source_note(source_note = "Source: Self-collected data") |>
opt_vertical_padding(scale = 0.25)| Crossword Solve Times: Descriptive Statistics | |||||||
|---|---|---|---|---|---|---|---|
| Count | Mean | Minimum | 1ˢᵗ Quartile | Median | 3ʳᵈ Quartile | Maximum | |
| Los Angeles Times | |||||||
| Monday | 49 | 6.2 | 4.2 | 5.4 | 5.9 | 6.9 | 10.8 |
| Tuesday | 40 | 7.5 | 4.6 | 6.1 | 7.4 | 8.1 | 12.3 |
| Wednesday | 35 | 8.7 | 4.7 | 7.0 | 8.1 | 9.9 | 20.2 |
| Thursday | 35 | 12.1 | 6.0 | 9.0 | 11.0 | 13.6 | 35.6 |
| Friday | 29 | 14.4 | 7.0 | 11.0 | 13.3 | 17.8 | 29.2 |
| Saturday | 21 | 23.5 | 10.8 | 15.8 | 22.3 | 31.8 | 45.4 |
| Sunday | 13 | 27.3 | 16.9 | 23.7 | 26.8 | 28.1 | 41.0 |
| New York Times | |||||||
| Monday | 72 | 5.4 | 3.0 | 4.7 | 5.2 | 6.2 | 8.7 |
| Tuesday | 63 | 7.6 | 4.5 | 6.4 | 7.4 | 8.6 | 16.6 |
| Wednesday | 63 | 11.8 | 5.3 | 9.1 | 11.6 | 13.6 | 26.9 |
| Thursday | 67 | 18.4 | 9.2 | 14.1 | 17.5 | 21.6 | 40.0 |
| Friday | 56 | 20.7 | 6.4 | 14.0 | 18.8 | 24.2 | 54.5 |
| Saturday | 46 | 24.8 | 9.9 | 17.2 | 22.9 | 31.0 | 65.6 |
| Sunday | 37 | 32.1 | 3.6 | 24.1 | 26.1 | 38.9 | 68.7 |
| New Yorker | |||||||
| Monday | 42 | 26.5 | 10.6 | 17.5 | 21.7 | 32.6 | 64.9 |
| Tuesday | 56 | 13.9 | 5.2 | 9.5 | 12.3 | 15.7 | 37.2 |
| Wednesday | 64 | 7.8 | 3.7 | 4.3 | 6.9 | 10.1 | 20.6 |
| Thursday | 50 | 5.6 | 4.1 | 4.9 | 5.4 | 6.2 | 9.0 |
| Friday | 45 | 12.1 | 5.5 | 8.1 | 10.2 | 15.0 | 28.0 |
| Wall Street Journal | |||||||
| Monday | 18 | 6.7 | 4.3 | 5.8 | 6.2 | 8.2 | 9.8 |
| Tuesday | 16 | 9.1 | 5.8 | 6.7 | 9.0 | 11.1 | 13.0 |
| Wednesday | 12 | 13.9 | 8.8 | 10.7 | 13.1 | 17.2 | 22.2 |
| Thursday | 13 | 17.9 | 9.1 | 14.6 | 19.1 | 20.2 | 26.8 |
| Friday | 8 | 16.4 | 9.5 | 13.5 | 15.6 | 18.1 | 27.5 |
| Saturday | 14 | 31.4 | 15.9 | 27.0 | 32.1 | 34.4 | 46.7 |
| Source: Self-collected data | |||||||
It’s difficult to discern any story from a table like this. Let’s make a plot:
Code
crossword_times |>
  ggplot() +
  # plot structure
  facet_grid(cols = vars(publisher)) +
  # aesthetic mapping for the violins
  aes(y = minutes, x = day, fill = publisher) +
  # visual elements representing the observed data
  geom_boxplot(alpha = 0.5) +
  # scales
  scale_x_discrete(labels = c("M", "T", "W", "T", "F", "S", "S")) +
  scale_y_continuous(breaks = seq(0, 70, 5),
                     limits = c(0, 70),
                     expand = c(0, 0)) +
  scale_fill_viridis(discrete = TRUE) +
  # labels
  labs(title = "Crossword Solve Times",
       subtitle = "Box and whisker plot",
       x = "Day of the Week",
       y = "Solve Time (Minutes)") +
  guides(fill = "none") +
  # theming
  theme_swd()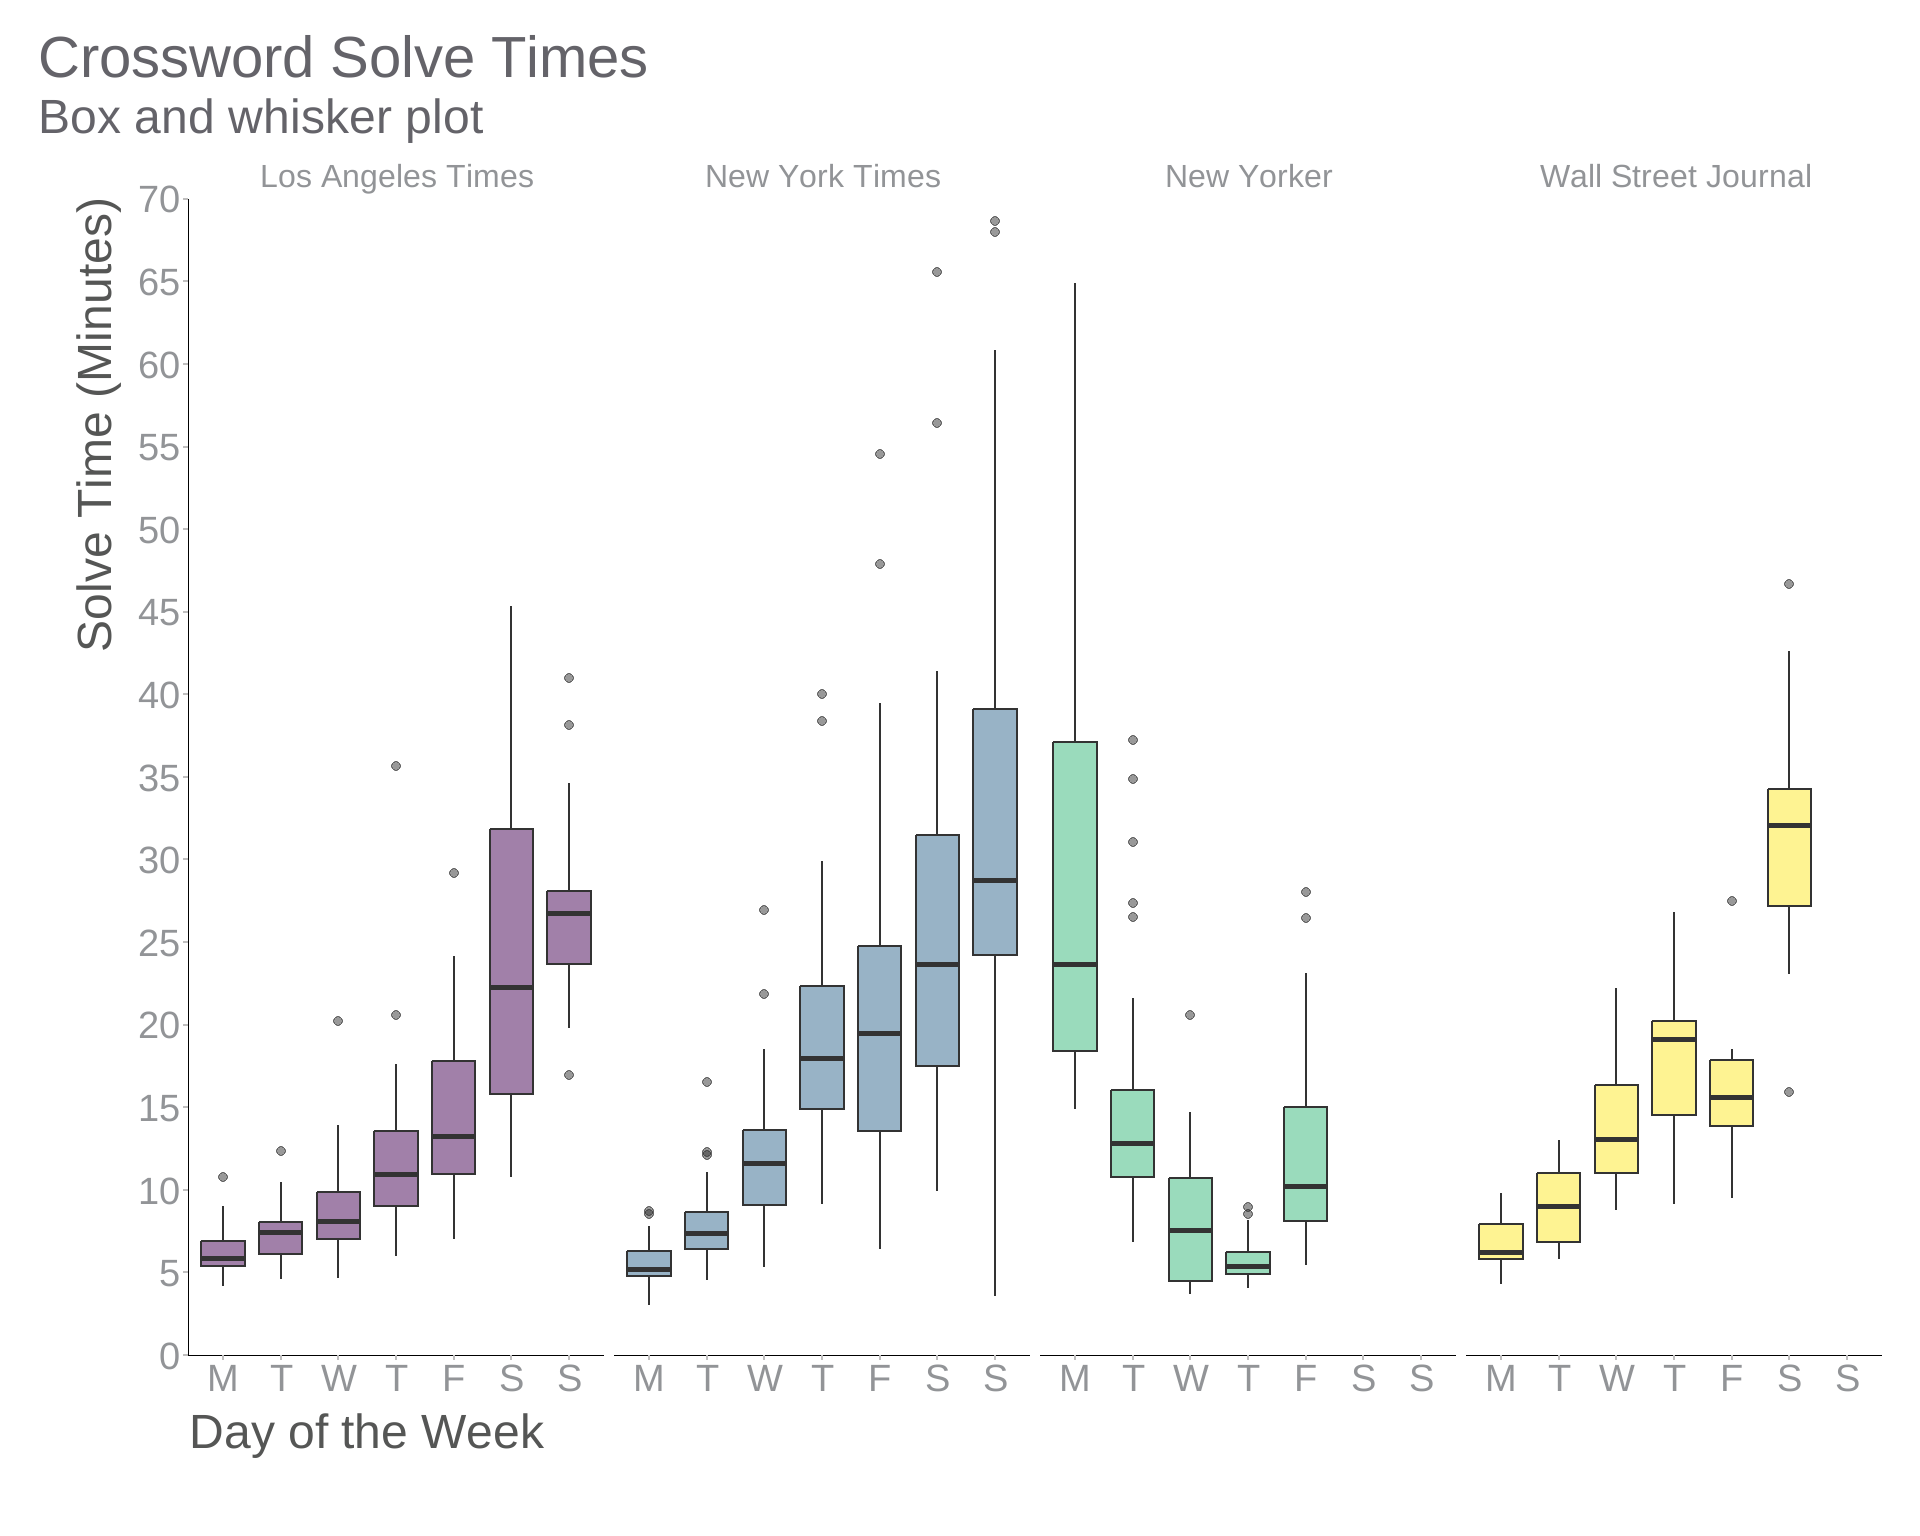
Now the relative difficulty of each group of puzzles stands out. So what’s the problem?
For one thing, notice that ggplot2’s geom_boxplot() function has identified some of the data points as outliers and plotted them separately. Is that appropriate for this data set? As the Wikipedia article on outliers points out:
There is no rigid mathematical definition of what constitutes an outlier; determining whether or not an observation is an outlier is ultimately a subjective exercise.
geom_boxplot() treats anything more than 1.5 times the interquartile range from the box as an outlier, but whether an observation should be considered an outlier obviously depends on the model we associate with the data-generating process. For example, an observation of x = 2 is fairly remarkable if X ~ Normal(0, 1) but not if X ~ Cauchy(0, 1), since the Cauchy distribution has fatter tails. And by using the same rule at both extremes of the sample, we implicitly assume the distribution is symmetric.1 2
1 Notice that nearly all the outliers in our box plot are at the high end.
2 See this article for more on issues with box plots in general.
Grouping the data by publisher and day of the week suggests that we believe the observations within each group are independent and identically distributed, even if we don’t explicitly say so. When we report a mean, we suggest that the sampling distribution has a finite mean.
Perhaps the idea that there’s a real distinction between descriptive and inferential data analysis ultimately stems from the “everything is normally distributed” fallacy.
Histograms, Density Plots, and Violins
It’s a matter of some debate among data visualization practitioners about when to use density plots, such as violin plots, instead of histograms. Or indeed whether density plots should ever be used. Or even whether histograms should ever be used!
Scientist and YouTuber Angela Collier doesn’t like violin plots:
One of the points she makes is that drawing density plots usually involves what amounts to fitting an unjustified model.
In most situations, ggplot uses locally estimated scatter plot smoothing (LOESS) by default, which involves fitting a separate polynomial regression model on a weighted neighbourhood around each data point and evaluating it there. This often results in serviceable violin plots, but you wouldn’t necessarily expect it to reflect the “actual” theoretical distribution of the data.
Designing charts is another situation in which we cannot avoid making modelling assumptions just because we insist we’re only doing “descriptive” analysis. As soon as you click “add trend line” in Excel, you’re fitting a model. Accepting this and being willing to specify a model allows us to create better data visualizations.
Let’s apply a simple Bayesian model of our crossword data and use it to design a violin plot in which the densities we present are actually justified.
Modelling
It’s plausible to think that crossword solve times would be distributed log-normally. As the name suggests, a log-normally distributed variable has a normally distributed logarithm. The relevant Wikipedia article lists a variety of phenomena which seem to follow a log-normal distribution, including the length of chess games, the incubation period of diseases, and incomes (except those of the very rich).
Fitting a Bayesian Log-Normal Regression
If we imagine that the distribution of solves times within each combination of publisher and day of the week is log-normal where the underlying normal distribution has some particular mean and standard deviation, we can provide that model specification to brms, accept some default priors, and have it estimate posterior distributions of those means and standard deviations based on the observed solve times.
crossword_times |>
  brm(formula = minutes ~ (1 + day | publisher),
      data = _,
      family = lognormal(),
      warmup = 1000,
      iter = 2000,
      chains = 4,
      control = list(adapt_delta = 0.95)) ->
  solve_time_model
Visualization
Since we were willing to actually specify a model, we can now make a density plot that shows something meaningful: the posterior predictive distributions corresponding to our model. We’ll use add_predicted_draws() from tidybayes to generate draws from those models and use these to draw violins that reflect the data we expect to observe in the future based on those we have observed so far. (We also enlist the help of data_grid() from modelr.)
Code
crossword_times |>
  data_grid(publisher, day) |>
  add_predicted_draws(solve_time_model) |>
  # filter out predictions for groups that do not actually occur
  filter(!(publisher == "New Yorker" & as.integer(day) %in% c(6, 7)),
         !(publisher == "Wall Street Journal" & as.integer(day) == 7)) |>
  ggplot() +
  # plot structure
  facet_grid(cols = vars(publisher)) +
  # aesthetic mapping for the violins
  aes(y = .prediction, x = day, fill = publisher) +
  # visual elements representing the posterior predictive model
  stat_eye(
    slab_colour = "black",
    interval_colour = NA,
    point_colour = NA,
    alpha = 0.5) +
  scale_x_discrete(labels = c("M", "T", "W", "T", "F", "S", "S")) +
  scale_y_continuous(breaks = seq(0, 70, 5),
                     limits = c(0, 70),
                     expand = c(0, 0)) +
  scale_fill_viridis(discrete = TRUE) +
  # labels
  labs(title = "Crossword Solve Times",
       subtitle = "Posterior predictive log-normal distributions",
       x = "Day of the Week",
       y = "Solve Time (Minutes)") +
  guides(fill = "none") +
  # theming
  theme_swd()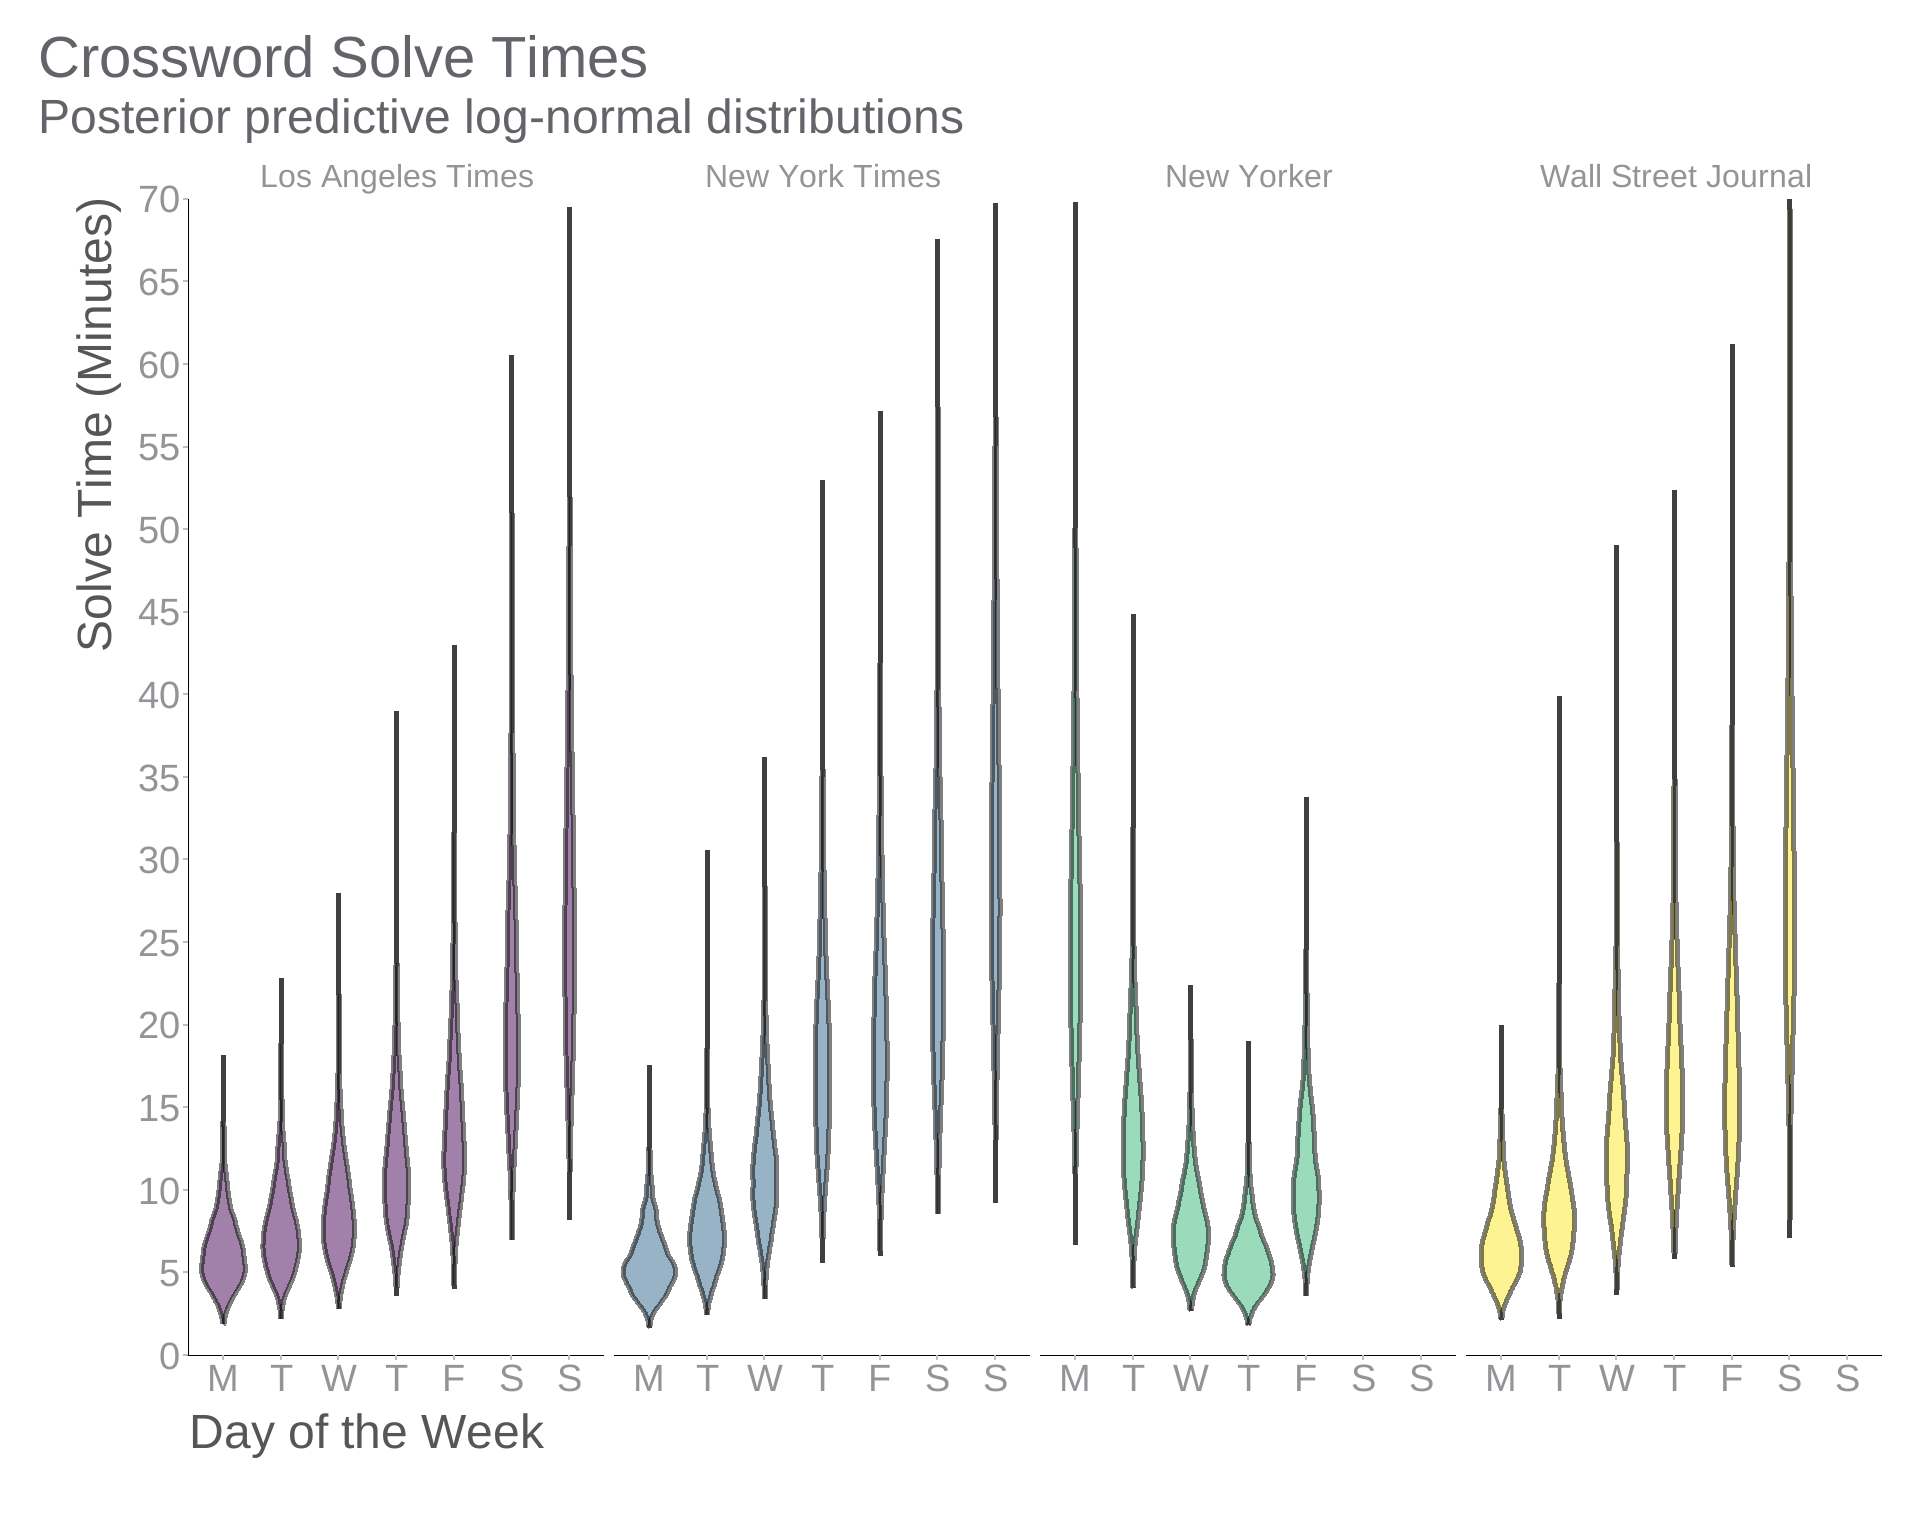
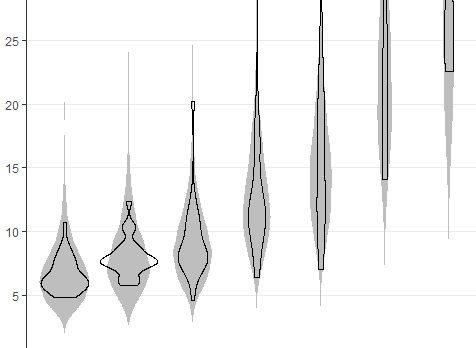
geom_violin vs Log-Normal Densities
What’s the difference between plotting LOESS-based densities and posterior predictive distributions? I think this image illustrates the shortcomings of the former approach well: