# read the file
read_delim(file = "runes_data.csv",
           delim = ";",
           skip = 3,
           na = "-",
           show_col_types = FALSE) ->
  # save to a dataframe
runes_data(Machine) Learning about Runes
Alphabetic algorithm alchemy.
Introduction
Today we’ll learn about an ancient Germanic writing system, clean up some messy data, engineer a couple of simple features, and see if we can find a way to predict the age of some historical artifacts without having to pay for a fancy-schmancy archaeology degree. Along the way, we’ll get a little overview of the tidyverse and tidymodels approaches to data analysis and modeling in R.
A Very Brief Primer on Runes
A rune is a letter from any of a handful of closely-related alphabets used by Germanic peoples primarily from around the 3rd to the 13th centuries CE. Like the Latin alphabet used to write the Germanic languages today, they derive from an ancient form of the Greek alphabet.1 These alphabets are sometimes called “futhark” (or “futhorc”, “fuþąrk”, etc.) after first few letters in their canonical order.2
1 Possibly via one of the alpine Old Italic alphabets such as Venetic.
2 Curiously, the first three letters of these alphabets spell out a vulgar word for a woman’s genitals in Old Norse.
The main runic alphabets are3:
3 The abecedaria, or “rune rows”, in this table are much simplified. In reality, there were many variations of each. The medieval runes in particular were augmented by diacritical dots in order to disambiguate sounds represented by the same rune in the younger futhark.
| Name | Main Language(s) | Era (c. CE) | Letters |
|---|---|---|---|
| Elder Futhark | Proto-Germanic, Proto-Norse | 1st–8th | ᚠ ᚢ ᚦ ᚨ ᚱ ᚲ ᚷ ᚹ ᚺ ᚾ ᛁ ᛃ ᛈ ᛇ ᛉ ᛊ ᛏ ᛒ ᛖ ᛗ ᛚ |
| Anglo-Frisian Futhorc | Old Frisian, Old English | 5th–11th | ᚠ ᚢ ᚦ ᚩ ᚱ ᚳ ᚷ ᚹ ᚻ ᚾ ᛁ ᛡ ᛇ ᛈ ᛉ ᛋ ᛏ ᛒ ᛖ ᛗ ᛚ ᛝ ᛟ ᛞ ᚪ ᚫ ᛠ ᚣ |
| Younger Futhark | Old Norse | 8th–12th | ᚠ ᚢ ᚦ ᚬ ᚱ ᚴ ᚼ ᚾ ᛁ ᛅ ᛦ ᛋ ᛏ ᛒ ᛘ ᛚ |
| Medieval Runes | Old Icelandic, Old Swedish | 12th–17th | ᚠ ᚢ ᚦ ᚮ ᚱ ᚴ ᚼ ᚿ ᛁ ᛆ ᛌ ᛐ ᛒ ᛘ ᛚ ᛦ |
Magical incantations were sometimes written in runes, but despite what such august institutions as the gift shop of the National Museum of Iceland would have you believe, there’s no evidence that each runic letter had a specific symbolic meaning.4 Neither is there much evidence that they were used in divination. These alphabets were used mainly for mundane purposes such as inscribing an object with its owner or creator’s name, and for memorializing the dead on gravestones. Nevertheless, in recent times these alphabets have become an element in various kinds of New Age mysticism, neo-pagan religions, and unsavoury political movements.
4 The runes have mnemonic names, and occasionally a rune could stand in for its name, but even this is rare.
RuneS-DB
RuneS-DB is a database of artifacts bearing runic writing compiled from a variety of sources as part of RuneS, an overarching project to study these writing systems. It’s available from the RuneS project’s website.
The rights to the data are held by the Göttingen Academy of Sciences and Humanities and are subject to the CC-BY- SA law. The RuneS research units Göttingen, Eichstätt-München and Kiel were involved in the generation of the data. RuneS-DB contains data from the Kiel Runenprojekt, the Danish database runer.ku.dk and the Samnordisk runtextdatabas/Rundata accessible under the Open Database License (ODbL). Please also note the additional information on other origin of the data provided under the label sources.
RuneS provides a tool on their website to query the database, but it’s pretty clunky. Instead, we’ll use R to see if we can learn anything interesting.
Tools
We’ll use the tidyverse collection of packages for manipulating and visualizing our data and the tidymodels packages to quickly define, train, and compare a few machine learning models. These packages “share an underlying design philosophy, grammar, and data structures” rooted in the “tidy data” principles originally espoused by Hadley Wickham.
This document was lovingly hand-crafted in artisanal, farm-to-table, GMO-free Quarto.
Reading and Cleaning the Data
Reading the File
The file we obtain from the RuneS website is tab-separated, contains three lines of preamble, and uses a hyphen to indicate missing data. Providing this information to readr’s read_delim will produce a tibble (i.e., a fancy data frame, which is in turn a fancy matrix) that we can begin to manipulate.
The Vimose Comb
One artifact we’d expect to find in RuneS-DB is the Vimose comb, which bears what’s considered to be the oldest known datable5 runic inscription. dplyr’s filter function and stringr’s str_detect let us filter the data to show only rows where value in the column of inscription names matches “Vimose comb”.6
5 Insert joke about “datable” here.
6 Just checking for rs_short_inscr_name == "Vimose comb" would fail because the values in that column have extra whitespace characters.
runes_data |>
  filter(str_detect(rs_short_inscr_name, pattern = "Vimose comb")) |>
  kbl() |>
scroll_box(width = "51.75%")| Findno | rs_short_inscr_name | rs_fundort | rs_short_storage | rs_extdat | rs_short_dat_art | rs_short_context | rs_objklasse | rs_objtyp | rs_short_obj_complete | rs_short_matklasse | rs_mat | rs_short_obj_state | rs_runenreihe | rs_short_museum | rs_short_ins_complete | rs_translat | rs_translit | rs_short_ins_state | rs_short_markings | rs_short_transkript | rs_namen | rs_fundjahr | rs_short_gemeinde | rs_short_bezirk | rs_short_landschaft | rs_short_land | rs_short_invnr | rs_short_kategorie | rs_short_sigils | rs_traeger |
|---|---|---|---|---|---|---|---|---|---|---|---|---|---|---|---|---|---|---|---|---|---|---|---|---|---|---|---|---|---|---|
| 20 | Vimose comb | Vimose | Museum | 140-160 | arch. | deposit find | tool/implement | personal hygiene | yes | bone/horn | antler | good | older fuþark | Nationalmuseet | yes | Harja. | harja | | good | nein | NA | Vimose-kam | 1865 | Allese Sogn | Odense Amt | Fyn | DK | 22657 | run. | Fyn 19 | comb |
So we can see that this object was found in Vimose, currently resides in a museum, has been dated to 140-160 CE, is a personal hygiene tool made of antler, says “harja” (ᚺᚨᚱᛃᚨ), etc.
Diagnosing
One way to quantify the messiness of a data set is to calculate the count and proportion of missing and unique values in each column. dlookr’s diagnose does this.
runes_data |>
  diagnose() |>
  kbl() |>
scroll_box(width = "51.75%")| variables | types | missing_count | missing_percent | unique_count | unique_rate |
|---|---|---|---|---|---|
| Findno | numeric | 0 | 0.0000000 | 8281 | 1.0000000 |
| rs_short_inscr_name | character | 7 | 0.0845309 | 5457 | 0.6589784 |
| rs_fundort | character | 34 | 0.4105784 | 3156 | 0.3811134 |
| rs_short_storage | character | 0 | 0.0000000 | 1723 | 0.2080667 |
| rs_extdat | character | 6 | 0.0724550 | 573 | 0.0691945 |
| rs_short_dat_art | character | 1988 | 24.0067625 | 19 | 0.0022944 |
| rs_short_context | character | 5240 | 63.2773820 | 21 | 0.0025359 |
| rs_objklasse | character | 33 | 0.3985026 | 13 | 0.0015699 |
| rs_objtyp | character | 1452 | 17.5341142 | 45 | 0.0054341 |
| rs_short_obj_complete | character | 1873 | 22.6180413 | 4 | 0.0004830 |
| rs_short_matklasse | character | 43 | 0.5192610 | 11 | 0.0013283 |
| rs_mat | character | 3550 | 42.8692187 | 119 | 0.0143702 |
| rs_short_obj_state | character | 1970 | 23.7893974 | 6 | 0.0007246 |
| rs_runenreihe | character | 463 | 5.5911122 | 12 | 0.0014491 |
| rs_short_museum | character | 4382 | 52.9163145 | 291 | 0.0351407 |
| rs_short_ins_complete | character | 1259 | 15.2034778 | 4 | 0.0004830 |
| rs_translat | character | 698 | 8.4289337 | 5592 | 0.6752808 |
| rs_translit | character | 91 | 1.0989011 | 7482 | 0.9035141 |
| rs_short_ins_state | character | 1371 | 16.5559715 | 6 | 0.0007246 |
| rs_short_markings | character | 2676 | 32.3149378 | 3 | 0.0003623 |
| rs_short_transkript | character | 1090 | 13.1626615 | 5536 | 0.6685183 |
| rs_namen | character | 5662 | 68.3733849 | 1554 | 0.1876585 |
| rs_fundjahr | character | 4895 | 59.1112185 | 700 | 0.0845309 |
| rs_short_gemeinde | character | 1435 | 17.3288250 | 1682 | 0.2031156 |
| rs_short_bezirk | character | 3287 | 39.6932738 | 406 | 0.0490279 |
| rs_short_landschaft | character | 1384 | 16.7129574 | 124 | 0.0149740 |
| rs_short_land | character | 48 | 0.5796401 | 28 | 0.0033812 |
| rs_short_invnr | character | 4709 | 56.8651129 | 2524 | 0.3047941 |
| rs_short_kategorie | character | 1227 | 14.8170511 | 15 | 0.0018114 |
| rs_short_sigils | character | 125 | 1.5094795 | 8129 | 0.9816447 |
| rs_traeger | character | 8 | 0.0966067 | 416 | 0.0502355 |
Unfortunately, RuneS-DB is a bit of a mess. Because it’s amalgamated from many sources, information is coded inconsistently. A mix of languages are used, including in the column names. Getting this data set clean enough to start visualizing it is easy enough using dplyr functions like rename(), separate(), and mutate().
The first step is to make the column names more informative and get rid of the weird “rs_” and “rs_short_” prefixes.
runes_data |>
  # rename the columns
  rename(
    find_number          = Findno,
    inscription_name     = rs_short_inscr_name,
    location             = rs_short_storage,
    date                 = rs_extdat,
    dating_method        = rs_short_dat_art,
    context              = rs_short_context,
    findspot             = rs_fundort,
    object_class         = rs_objklasse,
    object_type          = rs_objtyp,
    object_complete      = rs_short_obj_complete,
    material_class       = rs_short_matklasse,
    material             = rs_mat,
    object_state         = rs_short_obj_state,
    writing_system       = rs_runenreihe,
    museum               = rs_short_museum,
    inscription_complete = rs_short_ins_complete,
    translation          = rs_translat,
    transliteration      = rs_translit,
    inscription_state    = rs_short_ins_state,
    markings             = rs_short_markings,
    transcription        = rs_short_transkript,
    names                = rs_namen,
    find_year            = rs_fundjahr,
    community            = rs_short_gemeinde,
    district             = rs_short_bezirk,
    region               = rs_short_landschaft,
    country              = rs_short_land,
    inventory_number     = rs_short_invnr,
    category             = rs_short_kategorie,
    shelf_marks          = rs_short_sigils,
    carrier              = rs_traeger
  ) ->
  # update the dataframe
  runes_data
Next we’ll separate the location column into two columns, one with the general category and the other with the rest of the information. We’ll also create separate columns for the lower and upper bounds of each date, then convert this into a midpoint and a range.
runes_data |>
  # separate location category and detail
  separate(
    location,
    into = c("location_class", "location_detail"),
    sep = ":",
    extra = "merge") |>
  # separate the date column into lower and upper bounds
  separate(date, into = c("date_lower", "date_upper")) |>
  mutate(
    # set dates to NA for undated objects
    across(starts_with("date"), ~ na_if(., "0")),
    # treat the dates as numbers
    across(starts_with("date"), ~ as.numeric(.)),
    # get the middle of each date range
    date = (date_lower + date_upper) / 2,
    # get the range of each date
    date_range = date_upper - date_lower) |>
  # discard the date bounds
  select(-c(date_upper, date_lower)) ->
  # update the dataframe again
  runes_data
Next let’s convert RuneS-DB’s somewhat idiosyncratic country codes into human-readable names. While we’re at it, we’ll collapse the rarest ones into a “Rest of World” category.
runes_data |>
  mutate(
    country = recode(
      country,
      "S"  = "Sweden",
      "N"  = "Norway",
      "DK" = "Denmark",
      "IS" = "Iceland",
      "GB" = "Great Britain",
      "D"  = "Germany",
      "KN" = "Greenland",
      .default = "Rest of World")) ->
  runes_data
Finally some miscellaneous re-encoding.
runes_data |>
  mutate(
    # treat the ID numbers as strings
    find_number = as.character(find_number),
    # eliminate excess whitespace
    across(where(is.character), str_squish),
    # translate the markings column into English
    markings = recode(markings, "ja" = "yes", "nein" = "no"),
    # replace cross symbol
    across(where(is.character), ~ recode(., "†" = "lost/destroyed")),
    # replace "rune stick/rúnakefli", shorten "weapon/weapon accessories"
    object_class = recode(
      iconv(object_class, to = 'ASCII//TRANSLIT'),
      "rune stick/runakefli" = "rune stick",
      "weapon/weapon accessories" = "weapon/accessory"),
    # make "Museum" lowercase for consistency
    location_class = recode(location_class, "Museum" = "museum"),
    # combine parchment and paper into a single material class
    material_class = recode(
      material_class,
      "parchment; paper" = "parchment/paper",
      "parchment" = "parchment/paper",
      "paper" = "parchment/paper"),
    # give the writing systems friendlier names, combine medieval and post-Reformation runes as "manuscript runes"
    writing_system = recode(
      iconv(writing_system, to = 'ASCII//TRANSLIT'),
      "older fu?ark" = "elder futhark",
      "younger fu?ark" = "younger futhark",
      "fu?orc" = "anglo-frisian futhorc",
      "post-Reformation runes" = "manuscript runes",
      "medieval runes" = "manuscript runes",
      .default = "mixed/unknown")) ->
  runes_data
There’s more cleaning we could do, but this is enough for now.
Exploratory Data Analysis
runes_data |>
  drop_na(object_class, material_class) |>
  group_by(object_class, material_class) |>
  summarise(count = n()) |>
  ggplot(aes(x = object_class, y = material_class, size = count)) +
  geom_point(shape = 21, fill = "#595959") +
  coord_flip() +
  scale_size(range = c(0, 10)) +
  guides(size = "none") +
  labs(
    title = "Runic Artifacts by Object and Material Class",
    x = "Object Class",
    y = "Material Class")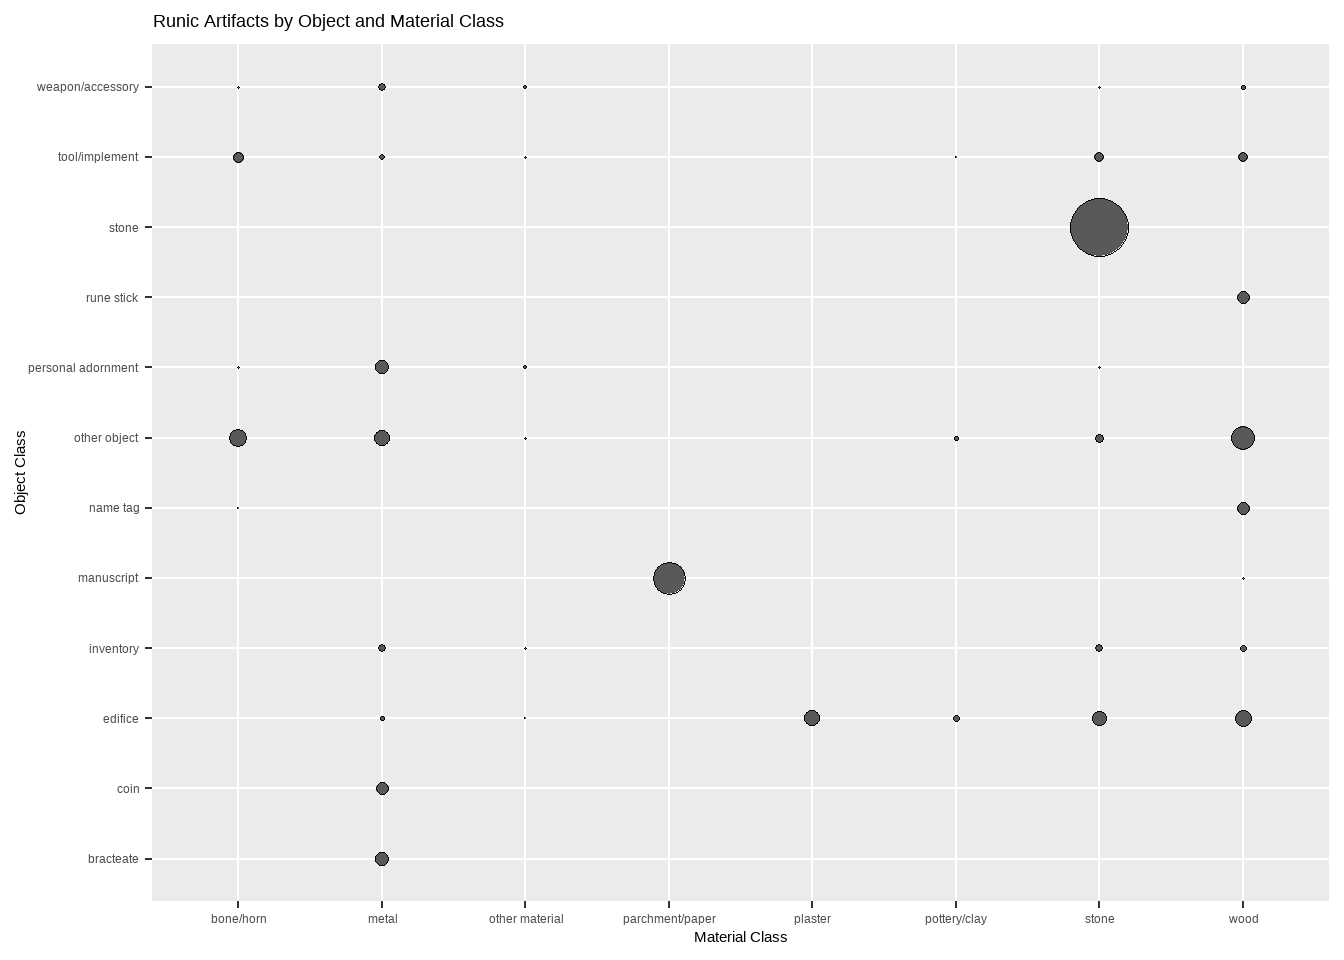
Nearly half of the artifacts in RuneS-DB are stones7, which it turns out are always made of stone! Likewise, coins and bracteates8 are always made of metal, and rune sticks are always made of wood. Tools, edifices, “inventory” (mostly furniture), and “other objects” all seem to come in a variety of materials.
8 What’s a bracteate, you ask? Why, it’s “is”a flat, thin, single-sided gold medal worn as jewelry”.
Where is this stuff typically found?
runes_data |>
  # discard artifacts missing country information
  drop_na(country) |>
  ggplot(aes(fct_infreq(country))) +
  geom_bar() +
  geom_hline(yintercept = seq(0, 4000, 1000), color = "white") +
  coord_flip() +
  labs(
    title = "Runic Objects by Country",
    x = "Country of Discovery",
    y = "Number of Objects")
Right. Scandinavia, mostly.
One last exploratory graphic. How old is this stuff?
runes_data |>
  # discard undated objects
  drop_na(date) |>
  ggplot(aes(date)) +
  # bin into centuries
  geom_histogram(
    fill = "#595959",
    color = "white",
    breaks = seq(1, 2022, by=100)) +
  geom_hline(yintercept = seq(0, 3000, 1000), color = "white") +
  scale_x_continuous(breaks = seq(0, 2000, by = 100)) +
  labs(
    title = "Number of Runic Objects by Century",
    x = "Year of Manufacture",
    y = "Number of Objects")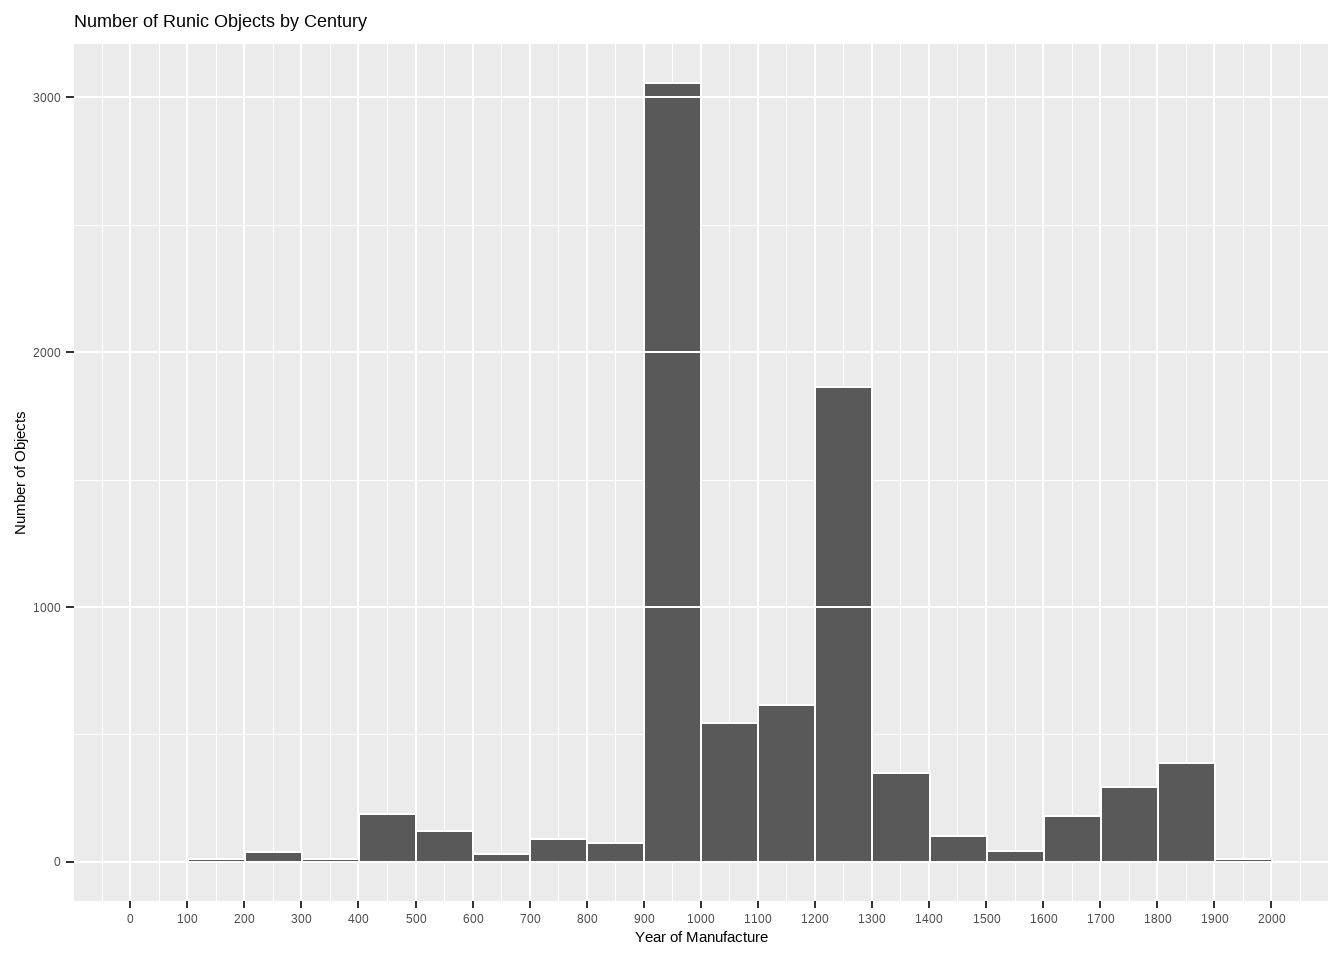
This histogram has a huge spike at the 10th century. Upon cursory investigation, this seems to be because the data set contains many rune stones with dated to the rather wide range of “725-1100”, i.e. the Viking Age. Obviously this data set is not random sample of all runic objects ever produced; some things are more likely to survive and be cataloged than others. The smaller spike at the 13th century seems to be more organic.
Feature Engineering
Suppose you’re lost in the woods in northwestern Europe9 and stumble upon some runes. Is there some rule you can use to estimate when they were carved (or written)?
9 What do you do if you’re lost in the woods in Iceland? Stand up.
First, we need to consider what features of the object you’d be able to determine. I think these are all reasonable:
- object class (stone, coin, etc.)
- material class (stone, metal, wood, etc.)
- country
- writing system (elder futhark, anglo-frisian futhorc, etc.)
- length of the inscription
- whether the inscription contains an abecedarium; something like “fuþarkgw…” or “abcdefgh…”
- whether the inscription seems to contain any of a few common words or morphemes
The first four of these features are already present in our data frame. We’ll have to “engineer” the others.
Unfortunately, the transliterations in RuneS-DB are very inconsistently encoded, but we can still get an approximate length of each inscription by converting the transliteration to ASCII10 and counting the number of resulting alphanumeric characters11. It’s too bad the database doesn’t simply use the runic characters included in Unicode, but perhaps that wouldn’t be sufficient to encode parts of the inscriptions which are unclear, damaged, combined into ligatures (so-called “bind runes”), etc.
10 Note that different operating systems have different ideas about how to convert other encodings into ASCII.
11 Plus question marks, to account for some of the non-ASCII letters.
runes_data |>
  mutate(
    inscription_length =
      transliteration |>
      # convert to ASCII
      iconv(to = "ASCII//TRANSLIT") |>
      # count alphanumeric characters
      str_count("[[:lower:]\\?]")) ->
  runes_data
We can identify abecedaria by slightly re-encoding the “category” column.
runes_data |>
  mutate(
    abecedarium = case_when(
      str_detect(category, "alphabet") ~ "abc",
      str_detect(category, "row") ~ "futh",
      TRUE ~ "no")) ->
  runes_data
Another feature we can derive from the inscription is what kind of spacing is used between words.
runes_data |>
  mutate(
    spaces = case_when(
      str_detect(transliteration, " [÷\\*\\+] ") ~ "crosses/stars",
      str_detect(transliteration, " × ") ~ "crosses/stars",
      str_detect(transliteration, " [ˈ\\.] ") ~ "single dots",
      str_detect(transliteration, " : ") ~ "double dots",
      TRUE ~ "none/other")) ->
  runes_data
Finally let’s encode the presence or absence of a few of the most common words/morphemes.
runes_data |>
  mutate(
    sin_sun_syn = str_detect(transliteration, "sin|sun|syn"),
    auk_uk_ok   = str_detect(transliteration, "auk|uk|ok"),
    at          = str_detect(transliteration, "at"),
#   fathur      = str_detect(transliteration, "faþur"),
    stain_stin  = str_detect(transliteration, "stain|stin|stӕin"),
    lit         = str_detect(transliteration, "lit"),
    across(sin_sun_syn:lit, as.numeric)) ->
  runes_data
Is this enough information to be able to predict the age of a runic inscription with any accuracy? Let’s try fitting a few different models using different approaches.
Model Fitting
Test/Training Data Split
First we’ll split the data into a training and a test set, then create cross-validation folds from training data to help estimate model performance.
runes_data |>
  # keep just the features we want to predict from
  select(
    object_class,
    material_class,
    country,
    writing_system,
    inscription_length,
    abecedarium,
    spaces,
    sin_sun_syn:lit,
    date) |>
  # discard objects with missing data
  na.omit() ->
  runes_data

# split into training (75%) and test (25%) sets, stratified by date
initial_split(
    data = runes_data,
    prop = 0.75,
    strata = date) ->
  split

# store a copy of each set
training(split) -> train
testing(split) -> test

# create 10 cross-validation folds
vfold_cv(train) -> folds
The tidymodels framework provides a unified interface to various model-specific packages, as well as convenient functions for defining, fitting, tuning, and comparing many combinations of data pre-processing recipes and model specifications.
In parsnip, the model type differentiates basic modeling approaches, such as random forests, logistic regression, linear support vector machines, etc.; the mode denotes in what kind of modeling context it will be used (most commonly, classification or regression); and the computational engine indicates how the model is fit, such as with a specific R package implementation or even methods outside of R like Keras or Stan.
Pre-Processing Recipe
Next we’ll define two pre-processing recipes. In both cases we’ll normalize our numeric predictor. Some model types require categorical predictors to be dummy-encoded, while others can exhibit better performance with categorical predictors left as-is. We’ll try both ways.
# create a pre-processing recipe
recipe(runes_data) |>
  update_role(date, new_role = "outcome") |>
  update_role(1:(ncol(runes_data) - 1), new_role = "predictor") |>
  # normalize the numeric feature
  step_normalize(all_numeric_predictors()) |>
  # dummy encode the categorical features
  step_dummy(all_nominal_predictors()) ->
  runes_recipe
Baseline
Now we can define our models. First let’s “fit” the null model, which consists of just always guessing the mean date value from the training set. It’s straightforward to simply calculate the appropriate RMSE estimate in this case, but for illustrative purposes we’ll use cross-validation anyway. It doesn’t matter which recipe we use since the null model ignores the predictors anyway.
null_model() |>
  set_engine("parsnip") |>
  set_mode("regression") ->
  null_spec

workflow() |>
  add_model(null_spec) |>
  add_recipe(runes_recipe) |>
  fit_resamples(resamples = folds, metrics = metric_set(rmse)) |>
  collect_metrics() |>
  pull(mean)
[1] 311.4979The null model’s prediction is, in a certain sense, off by more than three centuries on average. Surely we can do better than that.
The Bias-Variance Trade-off
Model Specification
We’ll try six more kinds of model. Each comes with some hyperparameters which control the bias-variance tradeoff, the step size for gradient descent, etc. We can leave tune() as a placeholder for these values when creating the model specifications. When we fit the models, we’ll try 10 combinations of hyperparameter values for each model type, and keep only the best ones.
A linear model assumes the outcome is a linear function of the predictors and finds the best coefficient to assign to each. Linear models are inflexible, and so tend to suffer from bias (unless the underlying relationship really is approximately linear), but they tend to have lower variance than more flexible model types, since their outputs are not too sensitive to small changes in their inputs. The penalty and mixture hyperparameters here control how much L1 (LASSO) and/or L2 (ridge) regularization to apply. Regularization penalizes more complex models in order to prevent overfitting.
linear_reg(
  engine  = "glmnet",
  penalty = tune(),
  mixture = tune()) ->
  linear_spec
A decision tree is essentially a flowchart, with each split corresponding to a rule in the form of an “if/then” condition on a predictor. The idea is to find the splits which best separate the outcome. Predictions are produced by taking the average outcome among the training data belonging to the relevant terminal node of the tree. tree_depth specifies the maximum depth of the tree; without some maximum, the training data could be completely interpolated (or “memorized”), an extreme form of overfitting. cost_complexity controls how well a split must separate its subset of the training data in order to be considered, and min_n controls how much training data must belong to a node in order to justify any further splitting.
decision_tree(engine     = "partykit",
              tree_depth = tune(),
              min_n      = tune()) ->
  decision_tree_spec
Nearest neighbours models predict that the value of the outcome for a test data point will be some kind of weighted average of that point’s nearest neighbours in the training data. neighbors controls the number of neighbours to consider and the other hyperparameters specify the precise notions of “weighted average” and “nearest” to use.
nearest_neighbor(engine      = "kknn",
                 neighbors   = tune(),
                 weight_func = tune(),
                 dist_power  = tune()) ->
  nearest_neighbours_spec
Boosted tree ensembles are a very popular machine learning approach involving fitting many small decision trees, each of which is optimized to improve the predictions obtained by combining the preceding trees. This model type inherents the hyperparameters involved in fitting decision trees, plus additional hyperparameters specifying the number of trees to use, the proportion of training data and number of predictors to consider at each step during fitting, as well as how much weight to initially apply to each new tree.
boost_tree(engine         = "xgboost",
           trees          = 1000,
           tree_depth     = tune(),
           min_n          = tune(),
           loss_reduction = tune(),
           sample_size    = tune(),
           mtry           = tune(),
           learn_rate     = tune()) ->
  boosted_trees_spec
Some approaches combine multiple other types of models. Cubist involves a tree ensemble with linear models fit on each tree node, a boosting-like procedure, and a final nearest-neighbours-based adjustment.
cubist_rules(engine = "Cubist",
             committees = tune(),
             neighbors = tune()) ->
  cubist_spec
Model Fitting
In tidymodels, a “workflow” is an object which bundles together a model specification together with any associated pre-processing recipes, hyperparameter values, and/or evaluation results. workflow_set and workflow_map allow us to tune all of our model specifications as a batch.
# combine the model specifications in a list
list(linear        = linear_spec,
     tree          = decision_tree_spec,
     nn            = nearest_neighbours_spec,
     boosted_trees = boosted_trees_spec,
     cubist        = cubist_spec) ->
  runes_model_specs

# set the prediction mode of each engine to "regression"
runes_model_specs |>
  map(~set_mode(., "regression")) ->
  runes_model_specs

# combine pre-processing recipe and model specifications into a workflow set
workflow_set(preproc = list(recipe = runes_recipe),
             models = runes_model_specs) ->
  runes_workflow_set

runes_workflow_set |>
  # for each model specification, try ten combinations of tuning parameters
  # and estimate rmse using cross-validation
  workflow_map("tune_grid",
               resamples = folds,
               grid = 10,
               metrics = metric_set(rmse)) ->
  # update the workflow set with the results
  runes_workflow_set
Performance Comparison
Now our workflow set contains ten fit models per model type for each of ten hyperparameter combinations. We can extract the best version of each model type and plot the cross-validated performance estimates.
# plot the rmse estimate from the best iteration of each type of model
rank_results(runes_workflow_set, select_best = TRUE) |>
  group_by(model) |>
  slice_max(mean) |>
  select(mean, std_err, model) |>
  rename(rmse_mean = mean, rmse_std_err = std_err) |>
  ggplot(aes(x = fct_reorder(model, -desc(rmse_mean)), y = rmse_mean)) +
  geom_errorbar(aes(ymin = rmse_mean - rmse_std_err,
                    ymax = rmse_mean + rmse_std_err),
                width = 0.1,
                size = 1.5,
                color = "#595959") +
  labs(x = "Model Type",
       y = "Estimated RMSE",
       title = "Estimated RMSE for Best Model of Each Type")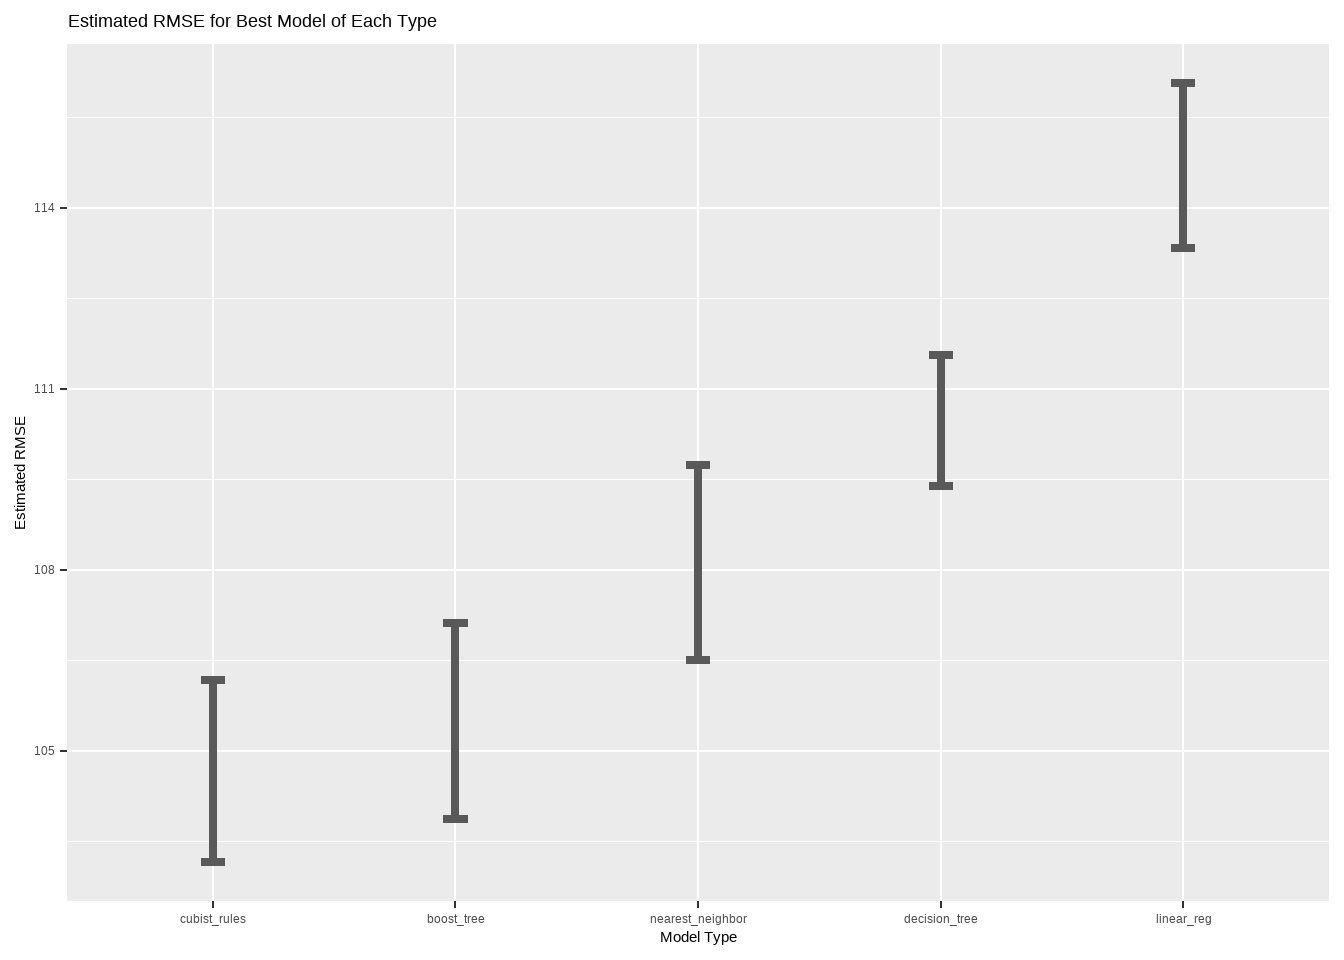
It appears that Cubist and boosted trees models work best for these data. Let’s finalize a Cubist model by re-fitting the best one on the entire training set, and seeing how well it predicts the age of artifacts in the test set.
runes_workflow_set |>
  # get the cubist workflow
  extract_workflow("recipe_cubist") |>
  # get the best cubist hyperparameters and apply them to the workflow
  finalize_workflow(
    runes_workflow_set |>
      extract_workflow_set_result("recipe_cubist") |>
      select_best(metric = "rmse")) |>
  # fit on the entire training set
  last_fit(split, metrics = metric_set(rmse)) ->
  final_cubist
The Performance-Explainability Trade-off
Unfortunately, our finalized Cubist model is useless. Since we’re lost in the woods, we can’t actually compute a prediction involving a complicated collection of trees of linear models with hundreds or thousands of coefficients and weights in total.
Can we find a simple decision tree with comparable performance by trying more hyperparameter combinations? Let’s set tree_depth to 3, find good values for the other hyperparameters, then finalize and evaluate the resulting decision tree model.
decision_tree_spec |>
  set_args(tree_depth = 3) |>
  set_mode("regression") ->
  decision_tree_spec

workflow() |>
  add_model(decision_tree_spec) |>
  add_recipe(runes_recipe) |>
  # try 100 combinations of cost_complexity and min_n
  tune_grid(resamples = folds, metrics = metric_set(rmse), grid = 100) |>
  # keep the best ones
  select_best(metric = "rmse") |>
  # plug them back into the model specification
  finalize_workflow(
    workflow() |>
      add_model(decision_tree_spec) |>
      add_recipe(runes_recipe),
    parameters = _) |>
  # fit on the entire training set
  last_fit(split, metrics = metric_set(rmse)) ->
  small_tree
Now we have two finalized models: a Cubist model and a small decision tree. The most obvious way to compare them would be to inspect their performance, but we can also use the vip package to extract the number of features used by each model, giving us a way to compare their relative complexity as well.
data.frame(
  model    = c("Cubist", "Small Decision Tree"),
  rmse     = c(final_cubist |> collect_metrics() |> pull(.estimate),
               small_tree   |> collect_metrics() |> pull(.estimate)),
  features = c(final_cubist |> extract_fit_engine() |> vi() |> filter(Importance > 0) |> nrow(),
               small_tree   |> extract_fit_engine() |> vi() |> filter(Importance > 0) |> nrow())) |>
  kbl() |>
scroll_box(width = "51.75%")| model | rmse | features |
|---|---|---|
| Cubist | 109.7088 | 38 |
| Small Decision Tree | 131.1698 | 7 |
The small decision tree’s predictions are about 16% worse than the best Cubist model we could find. On the other hand, it’s much simpler. While the Cubist model uses essentially all of the information we provided to it, since we constrained our decision tree to three levels, it can use only a maximum of seven features.12 Although the more complicated Cubist performs well, it’s difficult to explain exactly why, or what the role of each feature is in generating predictions. This illustrates the performance-explainability trade-off.
12 None of which are among the ones we engineered, as it happens.
Our small tree model is simple enough to write on an index card and keep with us when venturing out into the forests of rural Scandinavia. Here it is:
small_tree |>
  extract_fit_engine() |>
  as.simpleparty() |>
  plot(
    ip_args = list(pval = FALSE, id = FALSE),
    tp_args = list(
      id = FALSE,
      FUN = function(node){round(node$prediction[1])}))
Conclusion
If you can foresee yourself desperately needing to know the approximate age of a runic inscription, I recommend you write down the decision tree above and keep it in your pocket. That, or always bring a licensed and qualified runologist13 with you.
13 The real job title of perhaps an entire dozen people!